
Category: TRADE IDEAS
-
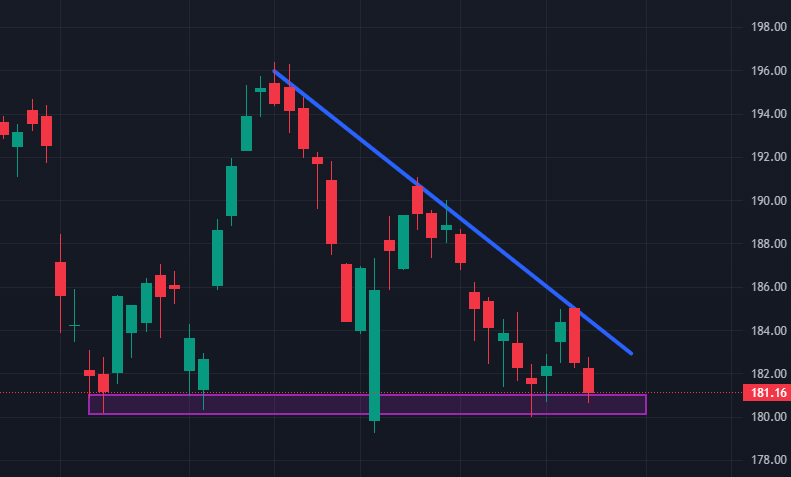
2/26/24: $AAPL SHORT
$AAPL: DAILY CHART – The support area has been hit 4 times, and price had less and less momentum each time. This means that buying pressure is decreasing, and the sellers will take over. – The price will likely break through the support area downwards, creating an opportunity for shorting.
-
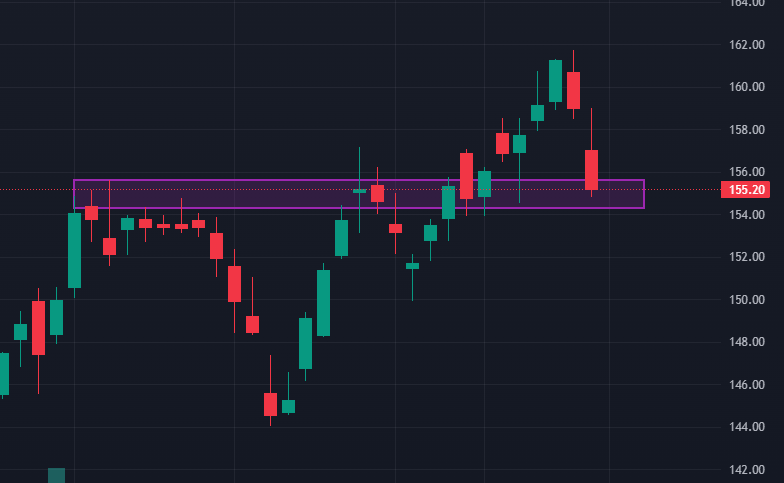
2/1/24: $AMZN LONG
$AMZN: DAILY CHART – Resistance was unable to be broken through at first. It later came back to the same price, testing it twice. – The sellers tried to push the price down, but buyers were aggressive enough to break the resistance level. – It is now at the new support area, signaling an upward…
-
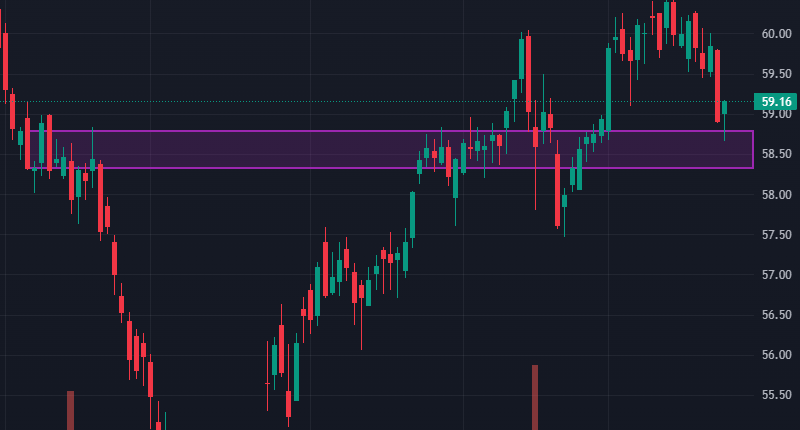
1/25/24: $KO LONG
$KO: DAILY CHART – There is high liquidity and indecisiveness in the highlighted area. – Price has just entered and reversed at that area, as shown by the last candlestick. This could indicate a short upward move in the stock and a good entry point.
-
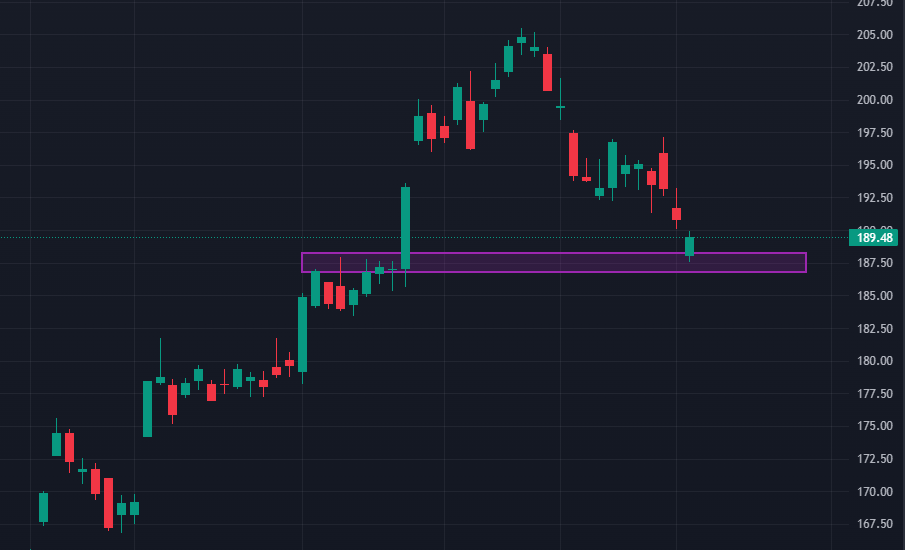
1/17/24: $IWM LONG
$IWM: DAILY CHART – The price of IWM has been making higher highs and higher lows, clearly indicating an uptrend. – IWM reached a resistance level, then broke through, came back down to the same level, making it a support area. – The price will likely continue upwards to at least $200 in the coming…
-
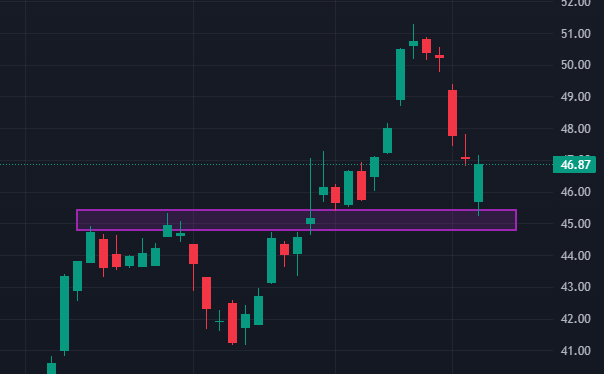
1/4/24: $INTC LONG
$INTC: DAILY CHART – The price of INTC was unable to break the resistance area at first. – After it broke the area and went higher, it came back down and used the old resistance area as support. – It will likely have more buying pressure now and rise to around $49.
-
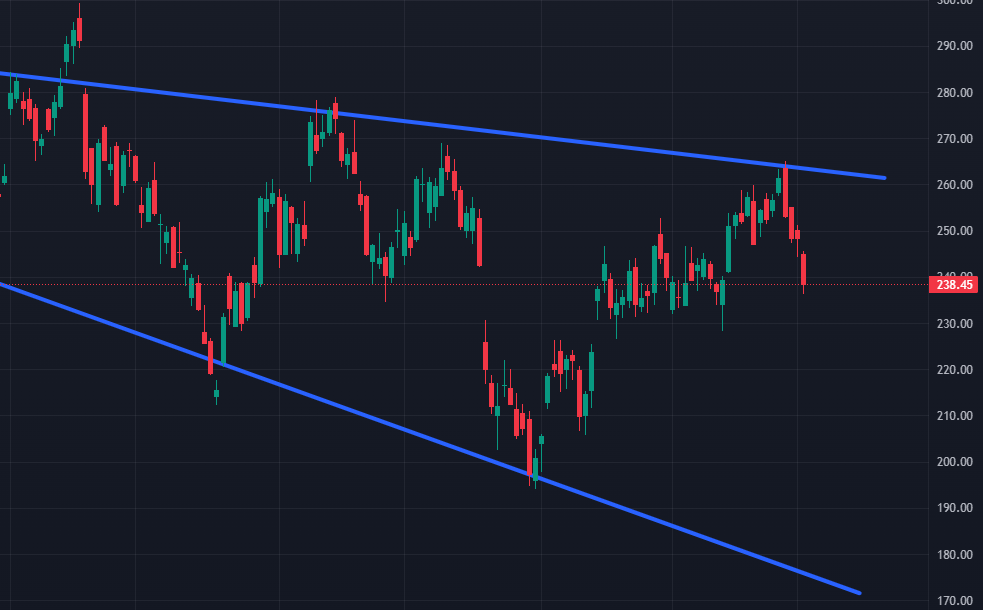
1/3/24: $TSLA SHORT
$TSLA: DAILY CHART – As shown in the chart, there is already a channel pattern formed. – The price of TSLA has reversed and will likely drop to the range of $190-$200 within the next month.