
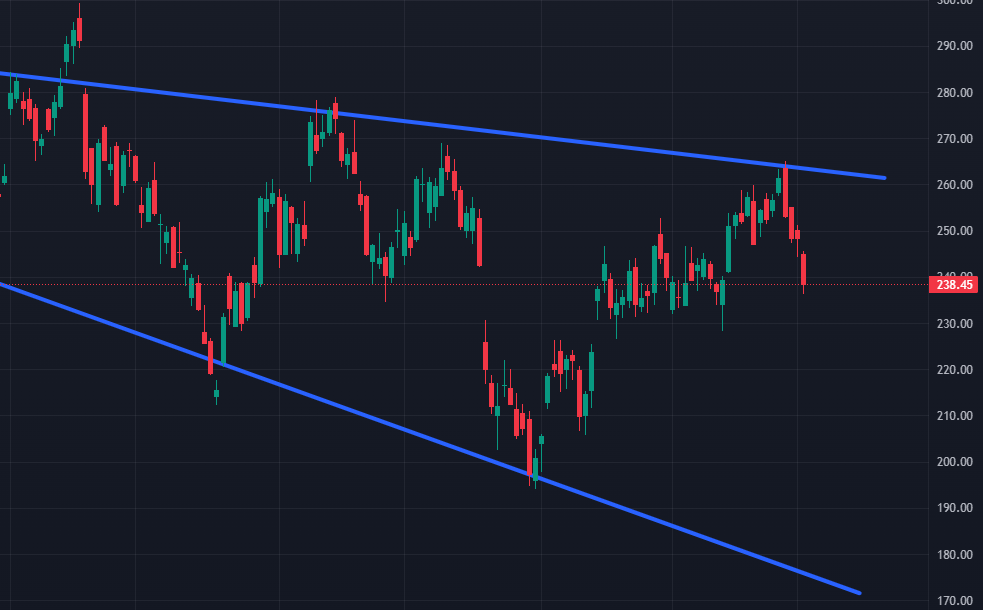
$TSLA: DAILY CHART
– As shown in the chart, there is already a channel pattern formed.
– The price of TSLA has reversed and will likely drop to the range of $190-$200 within the next month.
$TSLA: DAILY CHART
– As shown in the chart, there is already a channel pattern formed.
– The price of TSLA has reversed and will likely drop to the range of $190-$200 within the next month.
Leave a Reply